.png)
Blog
6
MIN Read
Every energy project starts with an idea. Add a battery to your site, co-optimize it with your renewables. But an idea only gets funded once it's translated into numbers, so spreadsheets get built and business cases get modelled, and they seldom reflect the truth accurately.
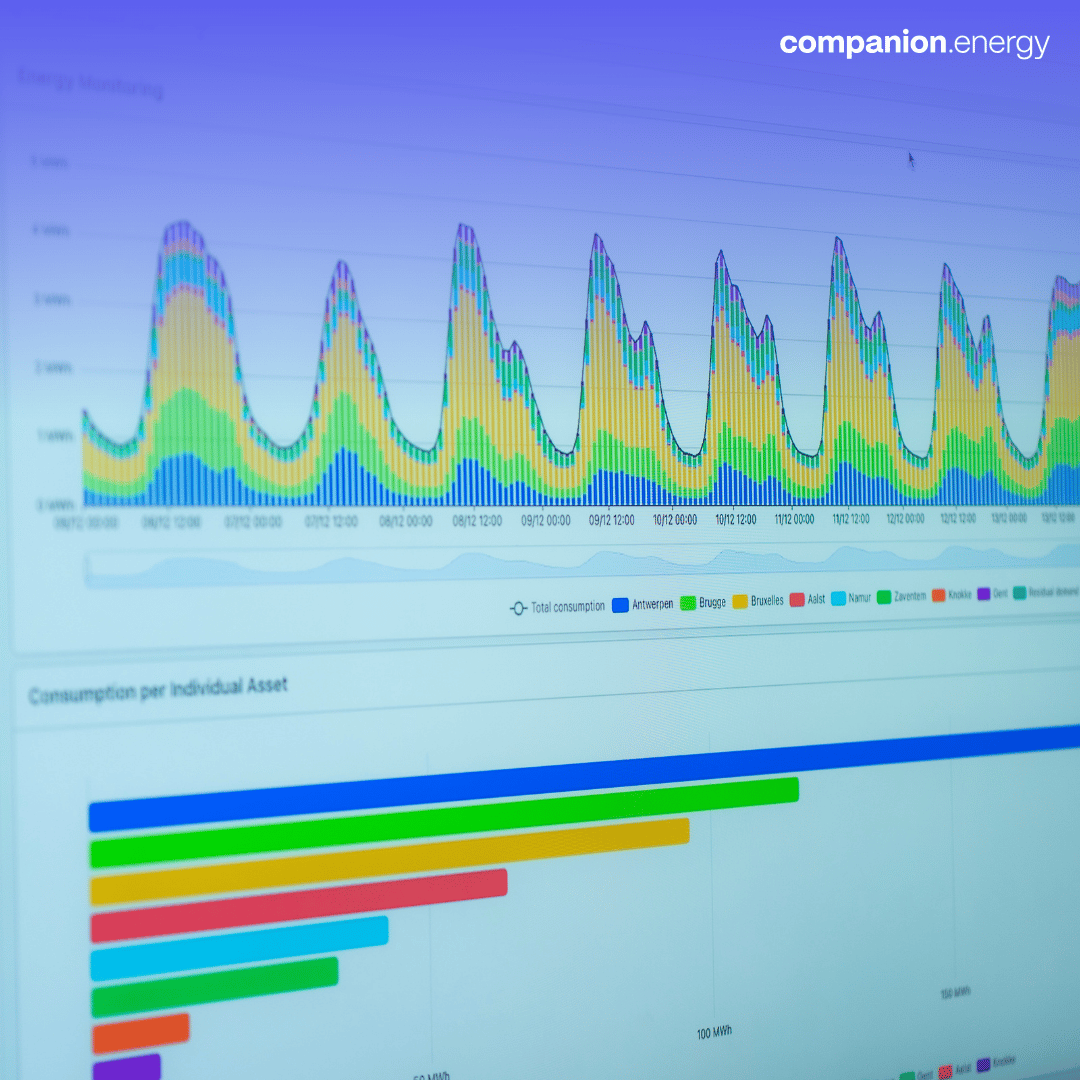


Every energy project starts with an idea. Add a battery to your site, co-optimize it with your renewables. But an idea only gets funded once it's translated into numbers, so spreadsheets get built and business cases get modelled, and they seldom reflect the truth accurately.
Most of those numbers are fiction. Not necessarily dishonest, just optimistic in a way that quietly assumes the world behaves perfectly. And buyers have learned to see it coming. When someone shows up with a business case built in Excel, promising savings that depend on always charging at the day's lowest price and always discharging at the peak, the reaction now is a raised eyebrow, not a signed contract. Luckily, most people know that you cannot trade with tomorrow's prices in hand.
So the bar has moved. Winning a customer today means going deeper than a headline figure. It means showing your work: proving that the savings survive real forecasts, real hardware limits, and a real grid connection. That's exactly what a Companion.energy backtest does: it takes a site's own metered history and replays it, quarter-hour by quarter-hour, to produce a savings number you can defend.
This is a capability we run for customers and partners. If you want a similar analysis for a site in your portfolio, just plan a call with us.
Here's how one of them went.
For one of our customers, we took their site, an unusually rich mix behind a single grid connection: a solar installation, a wind turbine, and a 1 MW battery the operator plans to install, with a C-rate somewhere between 0.5 and 1C. The grid connection has asymmetric offtake and injection limits, hard boundaries that can never be crossed. Today the site sits on a contract that only exposes it to day-ahead prices; the operator is weighing a move to a contract exposed to both day-ahead and imbalance prices, and wants to know what that would actually be worth.
The question was simple: if you add the battery and steer all three assets as one portfolio, how much is that actually worth in a year?
We ran a backtest across a full year of recorded 2025 data, using the site's real metered production and grid history. The only thing we simulated was the battery, dropped into the situation exactly as it unfolded. Everything else already happened.
A backtest is only as trustworthy as the shortcuts it refuses to take. Three principles kept ours honest.
First, no paper battery. Real batteries lose energy on every roundtrip, have fixed power and energy limits, and wear down under heavy cycling. We modelled all of it. There's no free storage here.
Second, no unconstrained grid. The connection's asymmetric offtake and injection limits were respected at all times. The optimizer had to earn its money inside the same box the site actually operates in.
Third, no perfect hindsight. At every quarter-hour, the optimizer could only use the information that was genuinely available at that moment: spot forecasts, imbalance forecasts, and production forecasts as they actually looked on the day. It never traded on a price nobody could have known. This is the single biggest difference between a backtest and a spreadsheet, and it's where inflated business cases fall apart.
We can't tell you what imbalance and spot prices will do next year, and nobody can. What this backtest does is remove every other source of exaggeration, so the number reflects how the strategy would have performed under real conditions instead of ideal ones. It's a grounded estimate, not a guarantee, and that honesty is precisely what makes it credible.
Steered this way, the site captures roughly €134,000 of modelled value per year. Two things make up that figure.
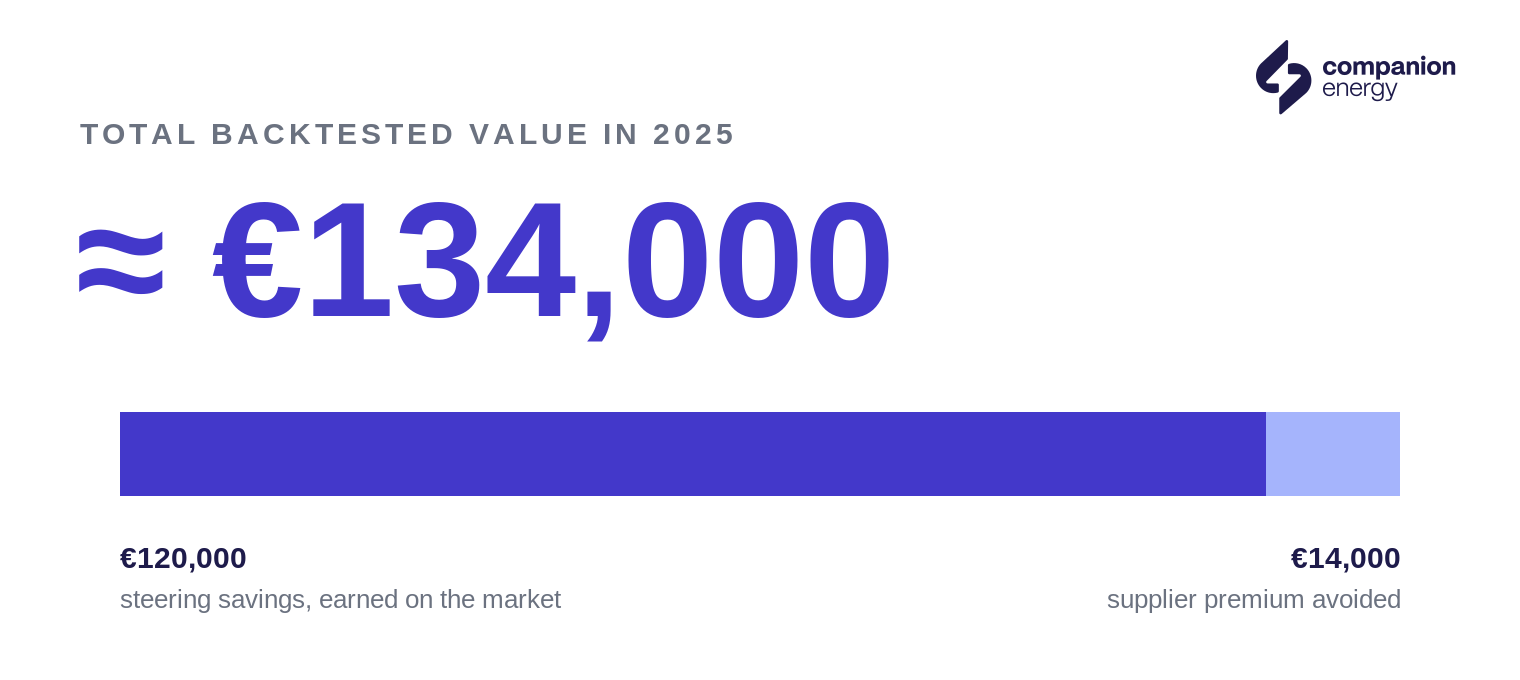
First, about €120,000 in steering savings across the year.
Second, about €14,000 the site avoids in supplier risk premium, which is a different kind of value from the steering savings, so it's worth being precise about. The €120,000 is money actively earned by steering the assets on the markets. The €14,000 is money the site simply stops paying: normally a supplier charges a risk premium, here about €3/MWh across the site's annual offtake, to shield a customer from imbalance prices and absorb that risk on their behalf. Once the battery turns imbalance exposure into something the site can manage rather than fear, that insurance is no longer worth buying, and the premium comes off the bill. One number is earned on the market; the other is a cost that disappears.
Together, that's the headline €134,000.
See what Companion could unlock for you →
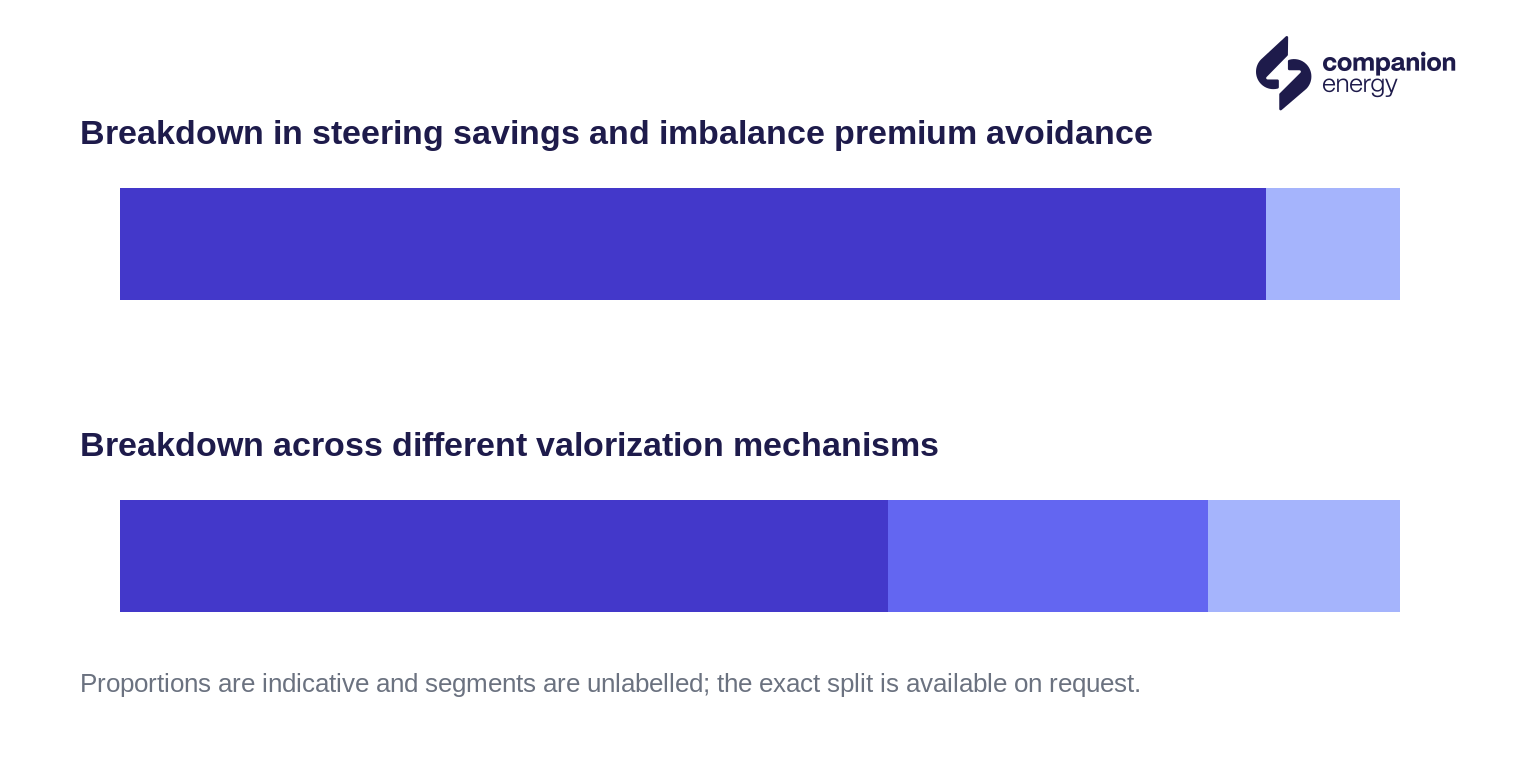
This is the part optimistic models tend to gloss over, and the part serious buyers care about most. The €120,000 of steering savings isn't one clever trade; it's the product of three mechanisms working together: positioning on the balancing market, timing on the day-ahead market, and managing grid costs. Because they're co-optimized as a single portfolio, the value doesn't split neatly into "this lever did that," and the exact mix is one of the more interesting things to walk through on a call. The charts below show the shape of it without the exact figures: first the total split into steering savings and the avoided imbalance premium, then the way the value spreads across the different valorization mechanisms.
The other question a careful buyer asks is whether the number leans on a handful of freak market events that may never repeat. It doesn't. The best single day contributed just 4% of the total, and even in the strongest quarter the top ten days together carried only about a third of it. The value accumulates across hundreds of ordinary days rather than a few dramatic ones.
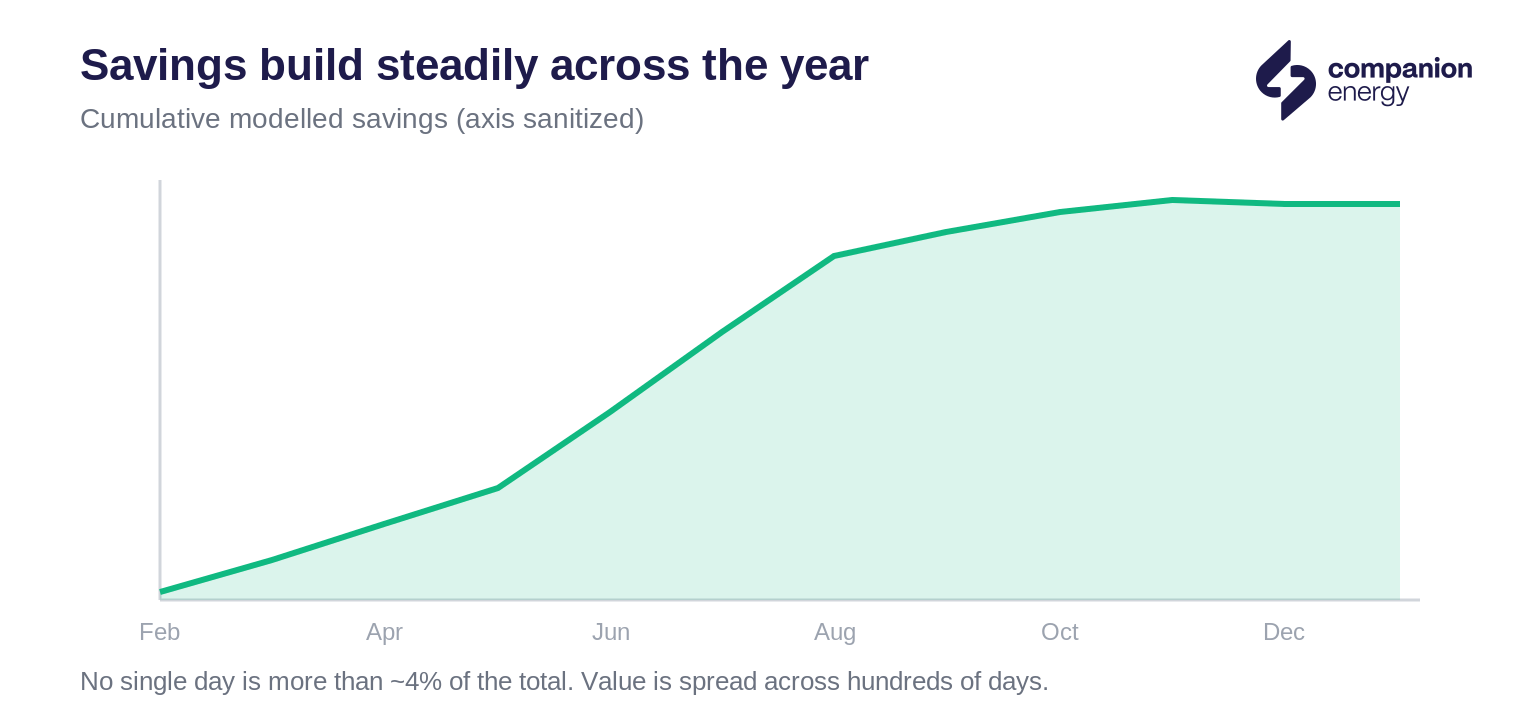
Some months simply offered less potential than others, and where the potential was lower, so were the savings. We don't hide that. The model doesn't manufacture trades that aren't there.
Behind the €120,000 sits a lot of small, disciplined decisions. In a single representative week, the optimizer made 672 quarter-hour decisions, and no two days followed the same pattern, because the pattern follows prices and production, not a fixed schedule.
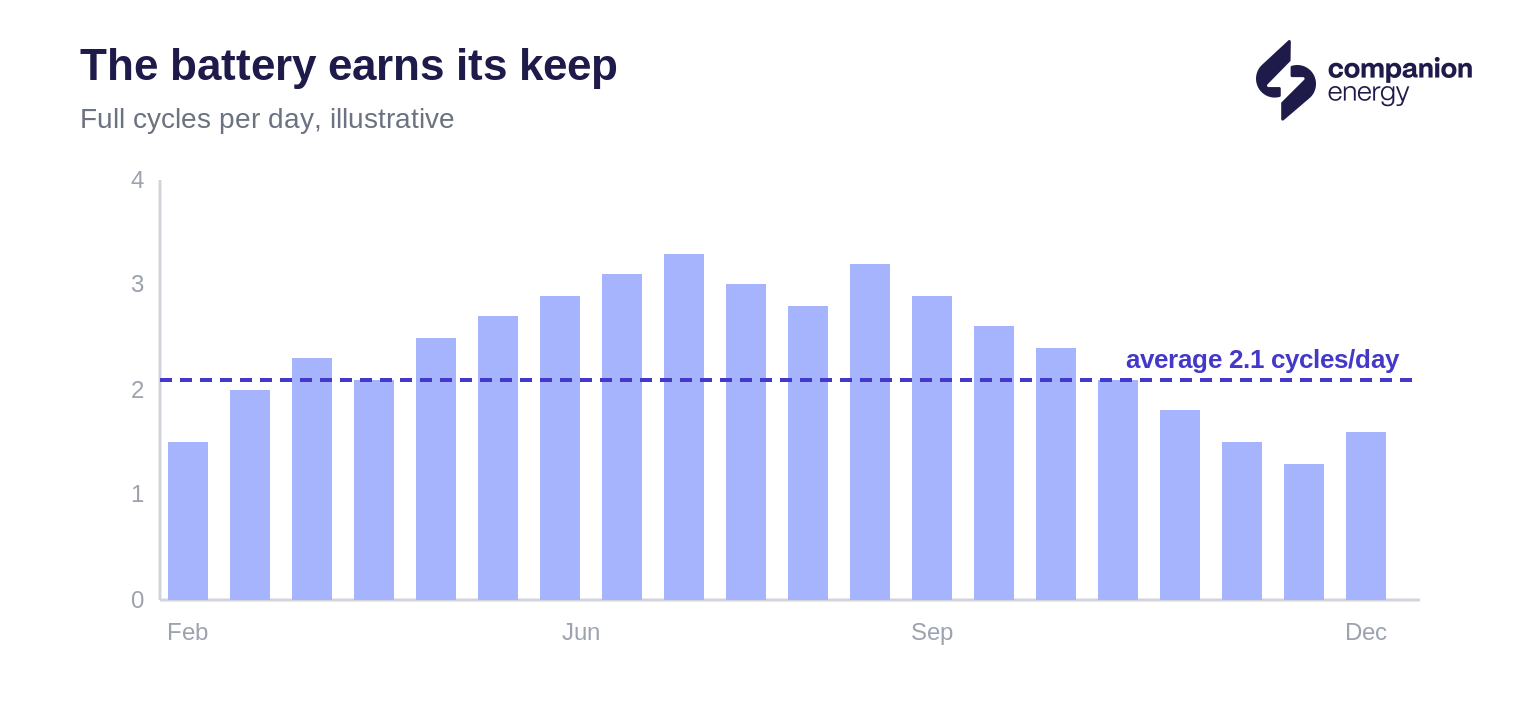
The battery averaged 2.1 full cycles a day, helped by the complementary availability of wind and solar: when one resource is quiet the other often isn't, giving the optimizer more moments worth acting on. Over the year that added up to roughly 2,100 MWh of energy moved through the battery.
The era of the silver-bullet optimization is over. Squeezing one market with one asset no longer makes a compelling case. Real value comes from co-optimizing every asset on a site across every mechanism available to the customer, day-ahead, imbalance, injection, self-consumption, all at once. That is harder to model, and it is exactly why a credible, detailed backtest has become the thing that wins the deal.
That capability is exactly what we make available to our partners on the Companion platform: realistic, physics-aware, forecast-honest backtesting on a site's own data. If you install, supply, or manage assets like these, you can put the same rigor behind your own business cases and win on credibility rather than optimism.
The analysis above wasn't a one-off study; it's a standard capability of the Companion platform, and we can run it for any site with the right data. Give us a site's metered history and contracts, and we'll replay it against real forecasts and real market prices to show what steering the battery and the site's renewables together would actually have been worth.
Get in touch to run a backtest for your site and we'll walk you through the results, line by line.
All figures are modelled results from a historical backtest on recorded 2025 site and market data, using only information available at each moment. Backtested performance is not a guarantee of future results.
There's plenty more to explore.
%2520(8).png)
Companion.energy manages, automates and optimizes your company’s energy. All in one smart platform.